How to use Cymobase's search modules
The database is searched using modules that can be combined in chains. There are nine different modules each providing specific options: a module for the full-text search in all species names, a protein classes search module, a taxonomy search module, a module to select specific groups of species, a module to search for domain related data, a sequence meta data seach module, a publication search module, a sequence name search module, and a gene search module. A search consists of any combination of modules and their options. By adding further search modules the user can successively refine the search and narrow down the result list. For each module the resulting selection of species, projects and publications is shown, providing additional context. When a new module is added the options available to the new module are restricted by the selection from the previous modules. At any time, the search options for every module can be changed and modifications are propagated down the chain reapplying previous user actions.
Note: All species results will be listed under the reference scientific name (according to the NCBI taxonomy browser). Thus anamorphs will be listed under their teleomorph names (e.g. if you are searching for Fusarium verticillioides the main entry will be Gibberella moniliformis citing F. verticillioides as anamorph) and the same accounts for alternative scientific and common names.

 Species Names Search Module
The full-text search module provides an autocompletion input field to search the list of scientific and common species names. The default setting is that all different subsets of species names are marked. You can use your mouse or keyboard to select a species from the autocompletion list but you have to press "enter" a second time to submit your selection.
Note: If you just enter a single letter you will get the list of all species starting with this letter, depending on your selection of scientific, alternative and/or other names.


 Protein Classes Search Module
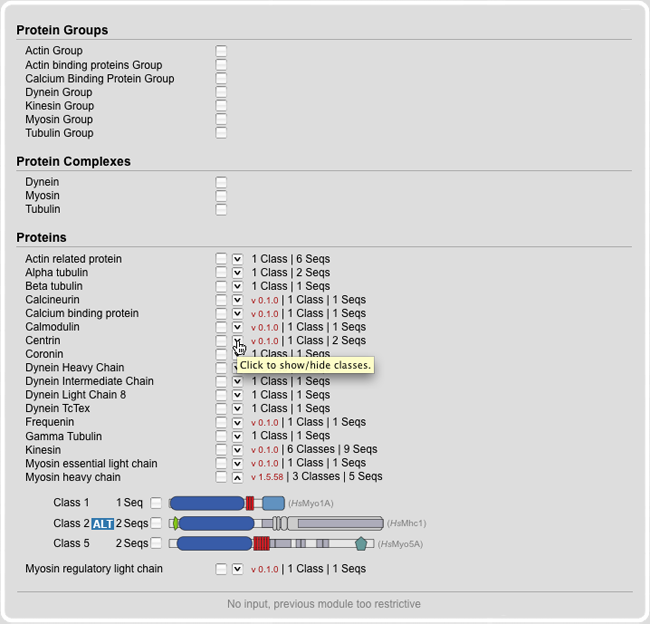
This module provides an overview of all proteins and their classes. There are three options: (A) Subsets of proteins can be selected by selecting a certain protein group All classes of a protein are accessible through the down side arrow. By selecting the box next to the protein all relating classes are selected at once. The class view gives additional information about the domains with the detailed domain picture and further links to PFAM. In every category the amount of sequences are shown immediately to get an impression of the inventory.
For better documentation all published proteins preserve a version number. This is to provide possibility for referencing to a particular sequences data set which can change due to future updates.

 Taxonomy Search Module
The Taxonomy Search Module offers tables containing specific subsets like a selection of major taxa or a range of model organisms. Several different strains have been sequenced for some of the model organisms. Those are marked with exclamation mark icons. In addition, on mouse-over the species names the complete scientific strain names are given.
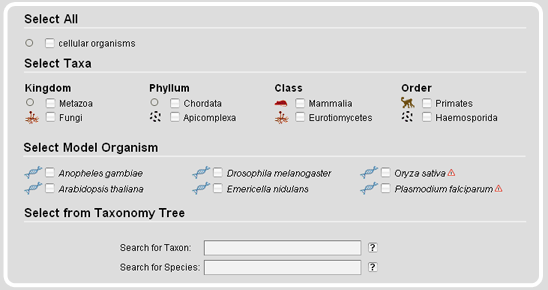
Note: If the dataset has been restricted by previous modules (e.g. the selection of a specific reference), excluded species and taxa are disabled in the tables and will not be shown in the taxonomic tree representation.
The taxonomy search module also provides a taxonomic tree representation for the selection of taxa and species. On top of the tree representation, there are two autocompletion input fields, one for taxa and one for species names. The species name input field accepts all different types of names, the scientific names, the alternatively used names, common names, and the anamorphs, while it selects the scientific reference name. After submission of the taxon/species name search, the taxonmy tree is reloaded with the selected taxon/species name opened.
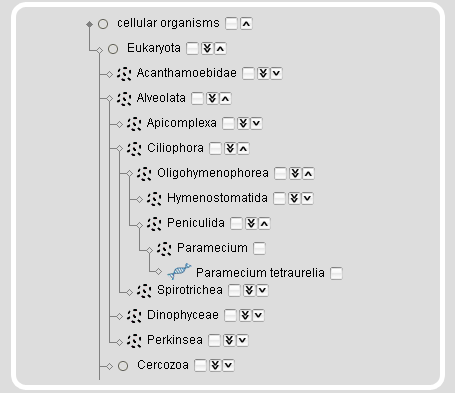
Instead of searching for taxa or species names, taxa and species can be browsed and selected by expanding/collapsing and including/excluding subsections of the tree.
| Clicking the arrow-down icon will expand the tree by 1 taxon. | |
| Clicking the double arrow-down icon will expand the tree by 5 nodes. On mouse-over the icon the number of sub-taxa and species will be given. | |
| Clicking the arrow-up icon will collapse the subtree. |
On mouse-over a species name an image of the species will be shown. Selecting a taxon will select the complete subtree and all species included. This will also select all taxa/species that are not shown based on restrictions in previous modules. The rationale is, that you might want to change your restrictions in a previous module but still want to keep your taxonomic selection. For example, if you restricted your search to genomic sequences in the projects module and selected the Arthropoda you will only see Arthropoda species with sequenced genomes. If you then change your selection in the projects module to also include the cDNA/EST projects, your species selection will automatically expand to include all Arthropoda for which genomic sequences and/or cDNA/EST data are available.
Note: Expanding the complete tree or major taxa (e.g. the Fungi/Metazoa group) will cause Firefox to take some time to render the updated view.

 Species Groups Search Module
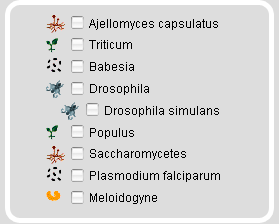
With the Species Groups Search Module specific subsets of species can be selected that do not necessarily correspond to certain taxa. We plan to expand this tool to show more general information about the species groups listed. These informations would include for example the ratio for the selection of the four Plasmodium falciparum strains for genomic sequencing. At the moment, only subsets of species can be selected.

 Domain Search Module
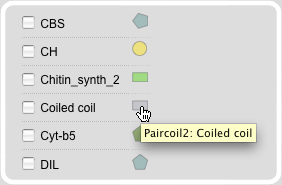
The Domain search module provides the possibility to select all sequences containing a specific domain. A list of domains combined with their graphical view provides a comprehensive survey of all available domains in the database. The domain pictures are clickable and link to further information about the domains via direct links to PFAM, prosite, and paircoils.

 Sequence Meta Data Search Module
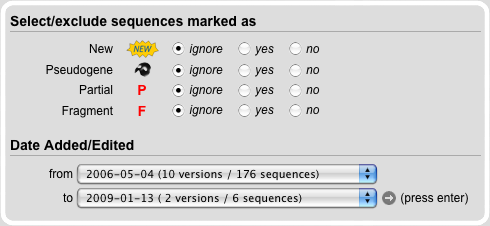
In the Sequence Meta Data Search Module sequences are selected based on four different types of information: new, pseudogene, partial and fragment. The default setting for each category is 'ignore' meaning that all sequences are included independently of whether they are part of the corresponding category of not. Options 'yes' and 'no' either include or exclude sequences of the corresponding category.
All sequences in the database get a version number so that changes can be tracked. With the version selection it is possible to select datasets that for example belong to one of our publications or that correspond to a specific time point in the history of our database. The default setting includes all sequences from the first to the last version.

 Publication Search Module
The publications related to the species and sequencing projects can be searched in several ways. Full-text searches are provided for titles, authors, abstracts, and journals. In addition, the journal search input field is supplemented with an autocompletion function. Searches can be restricted by dates. By default, searches are unrestricted.
Note: Only by selecting the Publications search module, the species and sequences are already restricted to those whose genome or cDNA/EST data or sequence has been referenced in a publication.


 Sequence Name Search Module
With this module specific sequences can be selected. For example sequence names found in publications citing the database can be entered (e.g. DmMyo1A or DmTim). The search in alternative names (protein names that have been used in other publications than those related to this database) results in all hits containing the search word.


 Gene Search Module
The Gene Module contains all search functions related to DNA data. Thus, sequences can be selected based on their source: (A) 'Sequence is from genomic Sequence' selects all sequences that were derived from any genomic DNA. (B) 'Sequence is from RNA/cDNA' selects all sequences that have been derived from RNA/cDNA sources. (C) 'Genome Sequencing' selects all sequences that have been derived from analyses of genome assemblies. Note: In contrast to (A), this option does not select sequences that have been submitted to GenBank as result of a single gene analysis.
Another option is to select all sequences for which gene structures are available in the database. All gene structure were obtained by searching the corresponding genome assemblies with WebScipio (www.webscipio.org).
By default, the options of all categories are set to 'ignore'. Options 'yes' and 'no' include or exclude the corresponding categories in the search filters.

Information provided by Cymobase's result views
 Sequence Result View
This view is the central gateway to the sequence data. According to the main philosophy, to provide the protein family analysis of whole genomes, all selected sequences are ordered by species. If specific sequences need to be compared, the corresponding SearchModules need to be adjusted, e.g. only specific protein classes of a subset of species should be selected. Below the species level, sequences are ordered by protein family membership. A survey of the genome for a specific protein is thought to be complete if the corresponding genome sequence is almost finished (assembly with high covarage data available) and we have finished our in-depth analysis not being able to identify further homologs of the protein. The sequence view provides the following information to the sequences by clicking on the corresponding symbols:

| AaBb1C | Sequence name composed of the species abbreviation (Aa), the protein abbreviation(Bb), and optional protein classifier (Number) and variant designations (Letter, e.g. C). |
| v 1.0.0 | A version number. This number is used to track any changes of the sequence and subsequent analyses data. |
| Class X | Class designation, if the protein sequences have been classified. Unclassified sequences are refered to as orphans. |
| This analysis tool provides numbers to basic analyses like amino acid composition, isoelectric point, extinction coefficients, instability index, and aliphatic index. | |
| Alternatively used names (maybe obsolete names) to the protein name are given if those have been used in publications or in the NCBI database submission. | |
| Domain representation of the sequence based on pfam, coiled-coil, and prosite pattern predictions. The schematic presentations are scaled to the longest sequence of the protein selection. | |
| If the mRNA or genomic DNA sequence has been published by a research group, the corresponding publication is given. | |
| A comment. | |
| Gene structure representations, with access to WebScipio for comprehensive descriptions. | |
| 3D-Structure information. | |
| Designation as pseudogene. | |
| Exclamation mark, if the annotated sequence may contain mispredicted exons. | |
| Accession numbers as well as the protein sequences. |
Extinction coefficients
An indication how much light a protein is absorbing at a certain wavelength can be derived from the extinction coefficient. It is helpful to have an estimation of this coefficient to be able to follow a protein within a spectrophotometer. The knowledge of the amino acid composition is sufficient for an estimation of the molar extinction coefficient of a protein [1]. The extinction coefficient of the native protein in water can be calculated with the following equation which includes the molar extinction coefficient of tyrosine, tryptophan and cystine (consider cystine for calculation due to cysteine's property to not absorb appreciably at wavelengths >260 nm) for a given wavelength:
E(Prot) = Number(Tyr) * Ext(Tyr) + Number(Trp) * Ext(Trp) + Number(Cystine) * Ext(Cystine)
where (for proteins in water measured at 280 nm):
Ext(Tyr) = 1490, Ext(Trp) = 5500, Ext(Cystine) = 125;
We are using the Edelhoch method for the calculation [2], but with different extinction coefficients for Trp and Tyr which were determined by Pace et al.[3]. Edelhoch determined the values for extinction coefficients for Trp and Tyr in pH 6.5, 6.0 M guanidium hydrochloride, 0.02 M phosphate buffer. Extinction coefficients are in units of M-1 * cm-1, at 280 nm measured in water.
Note: Cystin is an amino acid dimer and consists of two cysteine molecules which are joined by a disulfide bond.
The first two calculations (extinction coefficient and absorbance [optical density]) show the computed value based on the assumption that all cysteine residues appear as half cystines. The second two calculations assume that no cystine formation was build (no cystein appears as half cystine). Experience shows that the computation is quite reliable for proteins containing Trp residues, however there may be more than 10% error for proteins without Trp residues. This is being indicated above the calculations if this case occurs.
[1] Gill SC, von Hippel PH (1989) Calculation of protein extinction coefficients from amino acid sequence data. Anal. Biochem. 182, 319-326.
[2] Edelhoch H (1967) Spectroscopic determination of tryptophan and tyrosine in proteins. Biochemistry 6, 1948-1954.
[3] Pace CN, Vajdos F, Fee L, Grimsley G, Gray, T. (1995) How to measure and predict the molar absorption coefficient of a protein. Protein Sci. 11, 2411-2423.
Aliphatic index
The aliphatic index of a protein is defined as the relative volume occupied by aliphatic side chains (alanine, valine, isoleucine, and leucine). It may be regarded as a positive factor for the increase of thermostability of globular proteins. The aliphatic index of a protein is calculated according to the following formula:
where X(Ala), X(Val), X(Ile), and X(Leu) are mole percent (100 X mole fraction) of alanine, valine, isoleucine, and leucine. The coefficients a and b are the relative volume of valine side chain (a = 2.9) and of Leu/Ile side chains (b = 3.9) to the side chain of alanine.
Ikai A (1980) Thermostability and aliphatic index of globular proteins. J Biochem. 88 (6), 1895-8.
Instability Index (II)
The instability index calculates an estimate of the stability of the protein in a test tube. Statistical analysis of 12 unstable and 32 stable proteins revealed that there are certain dipeptides, whose occurence is significantly different in the unstable proteins compared with those in the stable ones. The authors of this method have assigned a weight value of instability to each of the 400 different dipeptides (DIWV). Using these weight values it is possible to compute an instability index (II) which is defined as:
where L is the sequence length and DIWV(x[i]x[i+1]) is the instability weight value for the dipeptide starting in position i.
A protein whose instability index is smaller than 40 is predicted as stable, a value above 40 predicts that the protein may be unstable.
Guruprasad K, Reddy BV, Pandit MW (1990) Correlation between stability of a protein and its dipeptide composition: a novel approach for predicting in vivo stability of a protein from its primary sequence. Protein Eng. 2 (2), 155-61.
GRAVY
The Grand average of hydropathicity (GRAVY) of the linear polypeptide sequence is calculated as the sum of hydropathy values of all amino acids, divided by the number of residues in the sequence. Increasing positive score indicats greater hydrophobicity, but no account is taken of the way the protein folds in three dimensions or the percentage of residues buried in the hydrophobic core of the protein. The calculation is based on the Kyte-Doolittle scale.
Kyte J, Doolittle RF (1982) A simple method for displaying the hydropathic character of a protein. J Mol Bio 157 (1), 105-32.
| Hydrophobicity Scales by Kyte-Doolittle | |||||||||||||||||||||||||||||||||||||||||
|
|
||||||||||||||||||||||||||||||||||||||||
 Publication Result View
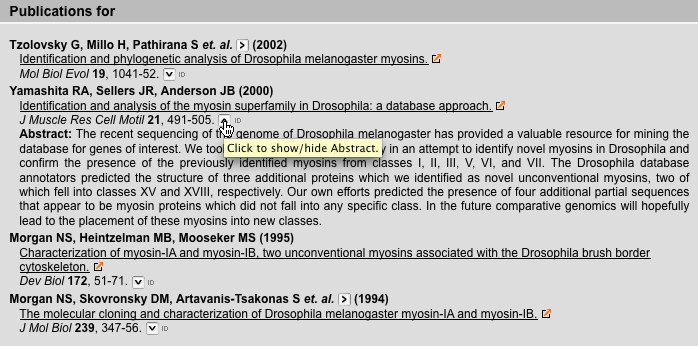
This view provides information on publications including authors, titels, journals, and abstracts.
 FASTA File Result View
The database provides four types of data in fasta-format for download. All sequences are sorted by proteins because we do not consider fasta files containing sequences from different proteins to be useful.

| Not Aligned / No Breaks | The selected sequences are not aligned (all gaps removed) and do not contain any breaks. |
| Not Aligned / Breaks | The selected sequences are not aligned (all gaps removed). There is a line break every 80 amino acids. |
| Aligned / No Breaks | The selected sequences are aligned (derived from the multiple sequence alignment of the protein and gaps common to all sequences removed) and do not contain any breaks. |
| Aligned / Breaks | The selected sequences are aligned (derived from the multiple sequence alignment of the protein and gaps common to all sequences removed). There is a line break every 80 amino acids. |
 Domain Composition Result View
This result view provides the domain composition schemes of the selected sequences. The sequences are sorted in the following order: protein class, protein variant, taxonomy. This ordering should be best to compare the domain composition of homologous proteins, e.g. HsMyo1A, MmMyo1A, and GgMyo1A. Of course, this holds true only if the protein sequences are classified and named consistently. Tooltips provide information about domain names and coordinates.

 Sequence Statistics Result View
Sorted by protein, several statistics are given. Statistics are available for protein related data, like total number of sequences, number of pseudogenes, number of complete proteins, fragments, and some "extremes". In addition, species related statistics are given, like the number of species analysed or the number of species that have been analysed based on whole-genome-shotgun data. Statistics are given as summary of the selected sequences. For some proteins, doi's (domain of interest) have been defined that are the basis for their nomenclature and classification. In these cases the position of the doi has been determined and completeness is given for both parts, the doi and the rest of the protein.
 Complex Inventory Result View
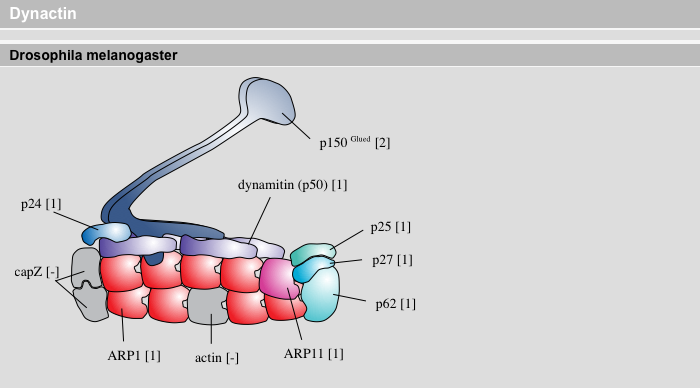
Some proteins are part of multi-protein complexes. If these complexes have been defined (there selection is available from the Protein Classes Module) there subunit composition is shown sorted by species. Duplicated genes are given in numbers. Thus, the evolution of the complexes can be analysed comparing their subunit composition.
 Protein Inventory Result View
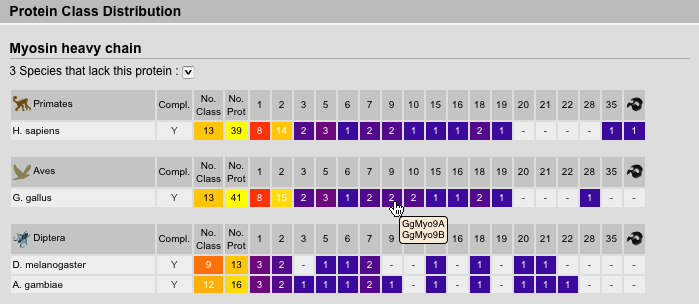
The protein inventory is sorted by proteins followed by taxonomy. Of course, this view is most useful, if all homologs of a protein were selected and not subclasses. Species names are abbreviated but full names are available via tooltips. The survey completeness as well as number of classes and sequences are given. A survey of the genome for a specific protein is thought to be complete if the corresponding genome sequence is almost finished (assembly with high covarage data available) and we have finished our in-depth analysis not being able to identify further homologs of the protein. Next the number of sequences corresponding to a certain class are given. Tooltips on these numbers show the list of sequence names.
 Molecular Weights Result View
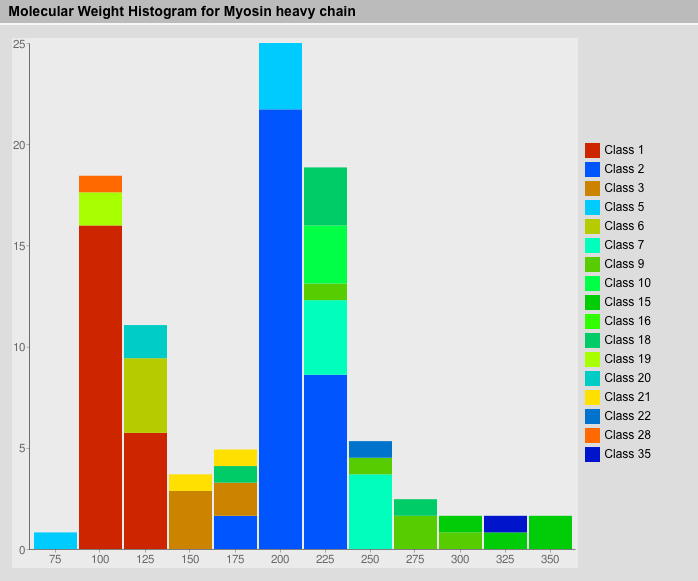
The molecular weights of the selected sequences are shown in a histogram sorted by proteins. Subclasses get different colours for better visualisation of characteristics of the protein classes.
 Class Composition Result View
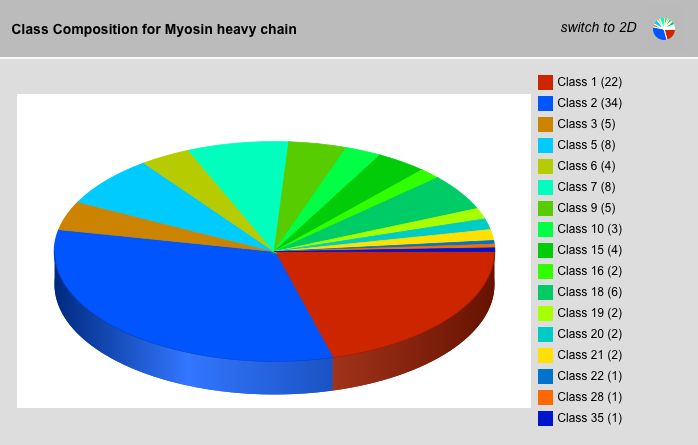
The class-composition-graph shows the class distribution of the selected sequences. The view can be changed between 2D and 3D.
